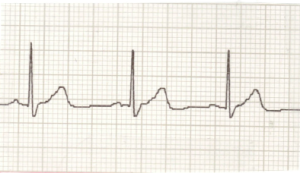
The electrocardiogram (ECG) is by far the most commonly performed cardiac test. You may have seen a picture of one in a book or a magazine, or you may have been drawn into the drama of this mysterious waveform, flashing periodically on a monitor during a tense moment of “E.R.” or “House.”
Have you wondered what the ECG is truly about?
The following Q&A will demystify the test as we begin to reflect on how the heartbeat comes about.
What causes a heartbeat?
The heart is the cause of its own heartbeat! That’s right; the heart is the only organ in the human body that moves by itself. If you can somehow take the heart out of the body and provide it with oxygen and nutrients, it will continue to beat regularly on its own.
How does the heart beat on its own?
The heartbeat is set in motion by the activity of a small collection of heart cells known as the sinus node (Label 1 in the diagram below). The cells of the sinus node spontaneously generate an oscillating chemical/electrical voltage which, in turn, sends an impulse of electricity to the rest of the heart tissue and heart muscle at regular intervals.
Each impulse from the sinus node propagates through the heart, because the heart tissue conducts this kind of chemical/electrical signal quite well. In response to this impulse, the parts of the heart that contain muscle cells contract in a coordinated manner and then relax—and that’s how heartbeat comes about!
What is the ECG?
Many decades ago, doctors discovered that the electrical signal that travels through the heart could be detected using wires and electrodes that are simply placed on the skin surface. For example, if one end of a wire (electrode) is held in the left hand and the other end is held in the right hand, the electrical signal generated by the heart can be picked up through the wire.
An ECG machine is a device that can amplify the signal and display it on a monitor or on paper. The recording is called the electrocardiogram, or ECG (sometimes spelled with a K, or EKG). As the signal generated by the sinus node moves through different parts of the heart, the corresponding voltage changes also, creating a characteristic waveform. Successive heartbeats normally display successive waveforms that look more or less identical.
Below is a tracing of my own ECG obtained by placing one electrode near my left hand and the other near my right hand using a simple portable ECG device.
How is the ECG read or interpreted?
Soon after the first reliable ECG machine was invented (in the 1910’s), doctors began to identify characteristic patterns in the ECG tracing. The waveform has “peaks and valleys” as it moves through different parts of the heart. These are usually identified with letters (P, Q, R, S, and T). The main point to realize is that the waveform is not a random squiggle but follows a recognizable pattern, as illustrated below:
A doctor reading an ECG will look at the relationship between successive waveforms (heart rhythm) and also look at the shape of the waveform. The ECG interpretation results from a careful analysis of this electrical signal.
What can the ECG identify?
The ECG can identify a great many things about the heart. Generally, abnormalities in the waveform pattern can be classified into two categories: those that reveal information about the heart rhythm and those that reveal information about the structure of the heart.
Typically, an abnormality of the heart rhythm is made manifest in the pattern with which successive waveforms show up on the recording over time. The waveforms may appear at irregular intervals or in some pattern that is distinguishable from normal.
An abnormality of the heart structure will typically appear in the particular shape of the PQRST waveform. For example, enlargement of a heart chamber or the presence of scar tissue may produce a specific “peak” or “valley” in the waveform that doctors can recognize.
It is worth noting that variations in the waveform do not always indicate any actual problem with the heart structure or function, but may simply reflect the fact that there is a range of normal heart behavior. In such cases, the ECG patterns are called “normal variants.”
It is also worth noting that the ECG does not detect all heart problems. Some people may have serious abnormalities with the heart, but their ECG looks normal. There can also be some ECG findings that are not normal but are not diagnostic of any particular condition. These are usually called “non-specific” findings.
What is a “12-lead” ECG?
Because the electrical signal traveling through the heart follows a certain direction at any given point in time, the placement of the electrodes on the surface of the body influences how the waveform is detected and how it appears on the recording. In a certain sense, pairs of electrodes placed in different locations look at the electrical signal from different vantage points.
Having multiple vantage points from which we look at the electrical signal gives us a lot more information to analyze, and this can help us better distinguish different conditions. Modern ECG machines now typically record the cardiac signal from 12 different perspectives simultaneously. The result is what is known as the 12-lead ECG.
I hope you have found this article useful. If you are interested in the information we provide, make sure you sign up for our free newsletter. The sign up form is in the footer at the bottom of this page.
Dr. Accad


![By J. Heuser [CC BY 2.5 (http://creativecommons.org/licenses/by/2.5)], via Wikimedia Commons](https://athleticheartsf.com/wp-content/uploads/2014/12/Conduction-system-of-the-heart.jpg)

![Image attribution: Agateller (Anthony Atkielski), converted to svg by atom. (en:Image:SinusRhythmLabels.png) [Public domain], via Wikimedia Commons](https://athleticheartsf.com/wp-content/uploads/2014/12/PQRST-wave-300x296.png)